New EPA Data Point to Which States and Cities Have the Most Lead Pipes
As of 2024 states and utilities report that there are more than nine million U.S. households drinking their water through lead pipes.

Szoka Sebastian
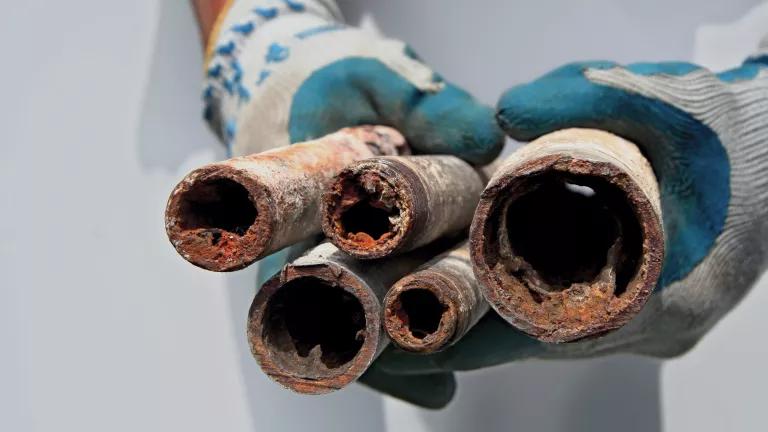
According to new data released by EPA, as of 2024 states and utilities report that there are more than nine million U.S. households drinking their water through what amounts to a lead straw. This updates a 2023 Drinking Water Infrastructure Needs Survey and Assessment (DWINSA). EPA conducts this survey every 4 years, but the most recent (7th Assessment) was the first to count how many lead service lines (LSLs), the pipes that deliver water from a main to a home, there are in the country. The new data refines EPA's estimates published last year and was publicly released after NRDC filed a Freedom of Information Act request for the data. The data includes city-by-city estimates of the number of lead pipes in each community.
This matters because LSLs are dangerous; they expose people to lead which is a neurotoxin so potent that scientists cannot identify a safe level of exposure for anyone. The Biden Administration pledged to remove those pipes, and Congress provided historically unprecedented funding to remove the pipes through the Bipartisan Infrastructure Law to the tune of $15 billion (over 5 years). How EPA allocates that $3 billion a year for 5 years depends on how many lead pipes EPA estimates are in each state and territory report through the DWINSA.
EPA conducted a DWINSA information request in 2021 and published those findings, but then in 2023 the agency provided an opportunity for states, territories, and water systems to provide updated information. They published those findings in May 2024.
According to this updated DWINSA, the states with the highest number of LSLs (including pipes with lead connectors or pipes made of potentially dangerous galvanized materials) are the following:
Ranking | State/Territory | Projected Lead Content | Non-Lead |
| 1 | Illinois | 1,071,355 | 2,667,910 |
| 2 | Florida* | 1,014,952 | 5,614,206 |
| 3 | Ohio | 809,990 | 2,808,748 |
| 4 | Pennsylvania | 662,717 | 3,096,598 |
| 5 | New York | 555,696 | 3,008,342 |
| 6 | New Jersey | 527,686 | 1,902,619 |
| 7 | Minnesota | 359,012 | 1,038,865 |
| 8 | Tennessee | 351,768 | 2,417,973 |
| 9 | Wisconsin | 343,834 | 1,178,673 |
| 10 | North Carolina | 311,173 | 2,845,103 |
*See below for analysis of this number, which many believe to strain credibility.
EPA also published the number of lead pipes reported in water systems. According to the update, the following water systems have the most lead pipes.
| Ranking | State | PWS Name | Pipes known to need replacement |
| 1 | IL | CHICAGO | 387,137 |
| 2 | OH | CLEVELAND PUBLIC WATER SYSTEM | 235,442 |
| 3 | NY | NEW YORK CITY SYSTEM | 111,616 |
| 4 | NY | SUFFOLK COUNTY WATER AUTHORITY | 97,337 |
| 5 | MI | DETROIT CITY OF | 83,717 |
| 6 | WI | MILWAUKEE WATER WORKS | 74,099 |
| 7 | CO | DENVER WATER BOARD | 63,955 |
| 8 | MO | ST LOUIS CITY PWS | 63,000 |
| 9 | LA | NEW ORLEANS CARROLLTON WW | 57,000 |
| 10 | IN | CITIZENS WATER - INDIANAPOLIS | 55,060 |
| 11 | MD | WSSC WATER | 51,604 |
| 12 | MN | MINNEAPOLIS | 48,502 |
| 13 | FL | COCOA, CITY OF | 40,038 |
| 14 | NY | BUFFALO WATER AUTHORITY | 40,000 |
| 15 | OH | COLUMBUS PUBLIC WATER SYSTEM | 35,733 |
| 16 | PA | PITTSBURGH WATER & SEWER AUTH | 32,849 |
| 17 | GA | ATLANTA | 31,060 |
| 18 | FL | MDWASA - MAIN SYSTEM | 29,940 |
| 19 | KY | NORTHERN KENTUCKY WATER DISTRICT | 27,532 |
| 20 | AR | CONWAY WATER SYSTEM | 27,143 |
| 21 | FL | PCUD-PASCO COUNTY REGIONAL PWS | 26,880 |
| 22 | MN | SAINT PAUL REGIONAL WATER SERVICES | 26,000 |
| 23 | NY | ROCHESTER CITY | 25,674 |
| 24 | FL | FORT LAUDERDALE, CITY OF | 25,498 |
| 25 | OH | YOUNGSTOWN CITY PWS | 25,061 |
These numbers will be used to make some adjustments to the amount of federal funding distributed to states and territories. EPA has stated that it has no plans to conduct additional updates during the period it is distributing these funds.
Many jurisdictions around the country are making great strides in counting the number of lead pipes that they have, but there is good reason to be concerned that these latest numbers from EPA do not tell the whole story.
For example, EPA’s own watchdog, their Office of Inspector General, recently raised concerns about the 2023-published data from EPA, and questioned its accuracy. In particular, both Florida and Texas submitted lead pipe numbers that have been scrutinized and many believe fail to be substantiated.
Florida received one of the largest allocations of federal funds based on the submission, although their allocation was adjusted downward in 2024 (but it remains one of the top recipients of federal dollars through this program). Many experts, including NRDC, have questioned the Florida estimate based on NRDC's and others' previous surveys, and the fact that most of Florida’s development occurred when lead pipes were not in widespread use nationally (Florida’s population was 2.8 million in 1950, when lead pipes were no longer being widely used in most parts of the U.S., and is now nearly 23 million).
While the $15B is a significant downpayment toward eradicating lead pipes across America, these dollars won’t be enough to fully solve the problem. This is why we need to ensure that these valuable resources—taxpayer dollars—are being used equitably and for their intended purpose. We also need active citizen engagement across the country to ensure that these replacements are done safely, equitably (at no cost to home owners), and following the example of cities that have solved their LSL problems without burdening low income water customers.
EPA must continue to scrutinize and fine tune these numbers to support equitable allocations or reallocations of federal funds in these crucial programs. Otherwise, we could see some states overcompensated and others shortchanged, with the most serious harms likely being felt by those communities that can least afford to tackle their lead water contamination threats.


