The BRIC Wall: Capacity Gaps Put FEMA Grants out of Reach
Prioritizing grant applications from underserved communities is only one piece of the puzzle. What about the communities who are unable to apply at all?
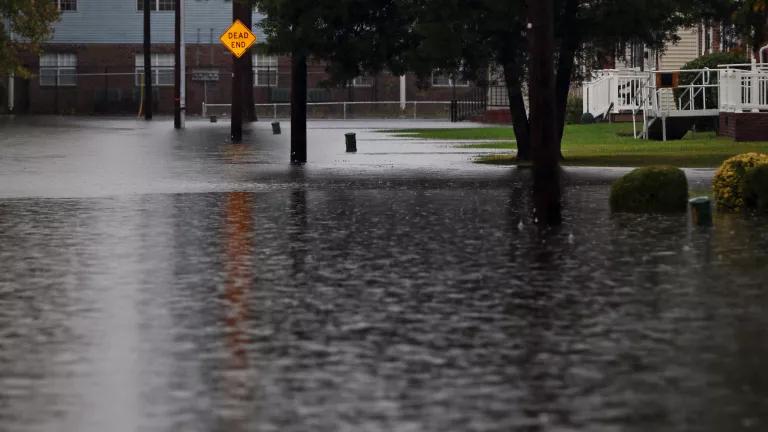
A flooded neighborhood in Hampton, Virginia after a day of flash flood warnings and heavy rainfall moved across the area in November 2020. FEMA did not select any of Hampton’s proposed BRIC projects for funding.
Photo by Aileen Devlin, Virginia Sea Grant. Shared under CC BY-ND 2.0.
The Biden administration has put equity at the top of its agenda, and to help achieve that goal it has revamped key federal grant programs that help communities prepare for climate-fueled disasters. While its initial efforts are encouraging, a new analysis by NRDC explores a deeper problem: in many cases, the communities who most need the funds lack the capacity to apply for grants in the first place.
FEMA’s Building Resilient Infrastructure and Communities (BRIC) and Flood Mitigation Assistance (FMA) grants are key components of the administration’s equity efforts. Both programs were included in the initial round of the Justice40 initiative, and FEMA leadership points to the funds as a way to “ensure the most vulnerable communities are not left behind, with hundreds of millions of dollars ultimately going directly to the communities that need it most.”
Over the past few years, FEMA has made some tangible improvements to both BRIC's and FMA’s selection and prioritization criteria, with the goal of having more funding reach low-income communities, communities of color, and others disproportionately burdened by the effects of climate change. However, there is still an enormous need to address the growing risks of disasters in a changing climate. Large amounts of FEMA funds still go to projects in wealthier jurisdictions like Orange County, California while smaller, less-privileged communities struggle to access resources.
Clearly, prioritizing grant applications from underserved communities is only one piece of the puzzle: What about the communities who are unable to apply at all?
The importance of local capacity
Preparing and submitting a federal grant application requires time, money, staff, planning, data, technical knowledge, and expertise in navigating government bureaucracy—a level of local capacity that is necessary not just for developing a successful project proposal but for addressing all sorts of environmental, social, and other community needs.
How does local capacity affect the outcomes of FEMA grant programs? Here at NRDC, we analyzed data on BRIC and FMA applications, looking for patterns not just among the winners but also of the whole applicant pool, including those who were not selected for funding. Our results suggest that the lowest-capacity localities are less likely to even apply for funding, meaning they will have no chance of receiving grants.
This illustrates why it’s so important for FEMA—and all agencies that offer competitive grants—to increase focus on capacity building and not rely only on prioritizing applications from certain communities. Identifying the areas that most need funding and prioritizing them during grant application review isn’t very effective if those communities are shut out of the very programs intended to help them.
Capacity distribution of grant applicants
Building on our preliminary assessments of BRIC selections in 2021 and 2022, we compared FMA and BRIC applications using different metrics for local capacity and social vulnerability, using FEMA data from fiscal years 2016–2021 for FMA and 2020–2021 for BRIC. We assigned each project to a county based on its title or description; while not all of the grant applications are submitted by counties (and most hazard mitigation projects serve specific cities, towns, or neighborhoods), decisions about planning and funding often happen at the county level, and readily available county-level datasets allow us to make nation-wide comparisons. If you are familiar with BRIC and FMA, you know that funding is typically awarded to states, tribes, and territories, who are the official “applicants” to FEMA. The cities, counties, and other local entities seeking funding submit “subapplications” through their state or territorial governments. For simplicity, however, we refer to those subapplications as “projects,” either “selected” or “proposed” depending on their status.
Overall, we found that higher-capacity jurisdictions are over-represented among both the programs’ selected projects and the application pool as a whole. For example, the chart below shows the distribution of Rural Capacity Index scores among all counties in the United States (in light blue), counties with FMA applications (in dark blue), and counties with selected FMA projects (in orange). Despite the name, the Rural Capacity Index, created by Headwaters Economics, includes information for the entire country—but with a special focus on highlighting the challenges of rural areas. The Index ranks locations on a scale from 1 to 100, with 100 representing the highest capacity.

Counties with FMA projects (regardless of whether FEMA selects those projects for funding) tend to have higher capacity than the country overall.
Higher Rural Capacity Index scores appear toward the left of the chart. Each bar shows the percentage of counties in a particular category; for example, 23% of the nation’s counties score between 61 and 70 on the Index. Perhaps unsurprisingly, counties with selected FMA projects are over-represented in the higher-capacity categories, relative to the rest of the country. However, there is very little difference between the capacity distribution of counties with selected projects and counties with proposed projects. In other words, the FMA applicant pool overall has a high level of capacity.
We see a similar pattern among the BRIC data, though counties with selected projects in the national competition (shown in green in the chart below) tend to rank even higher on the Rural Capacity Index.
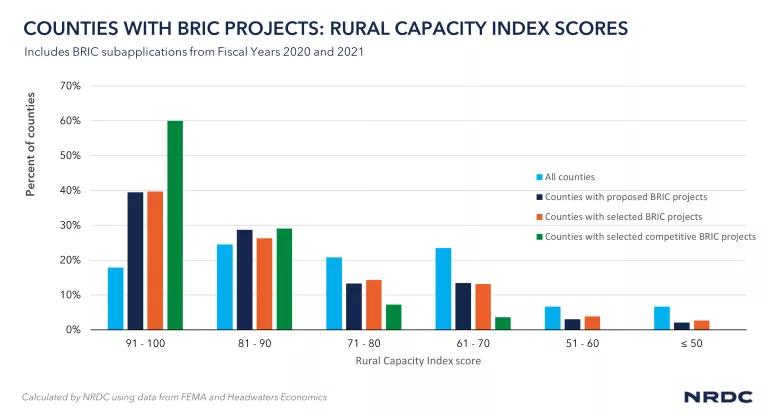
Counties with BRIC projects (regardless of whether FEMA selects those projects for funding) tend to have higher capacity than the country overall. Counties with projects selected under the BRIC national competition tend to have the highest capacity.
The Rural Capacity Index is only one way to represent the characteristics of a place. Measures of social vulnerability can be used to describe a group’s underlying susceptibility to the effects of natural hazards, which is influenced by social and economic factors like wealth, housing quality, and access to transportation.
The chart below shows the social vulnerability component of FEMA’s National Risk Index for counties with FMA projects. The National Risk Index compares locations using national percentiles, so 20% of U.S. counties fall into each quintile. As shown in the chart below, counties in the FMA applicant pool tend to have low social vulnerability (that is, they are less vulnerable and more capable of adapting) compared to the country overall.
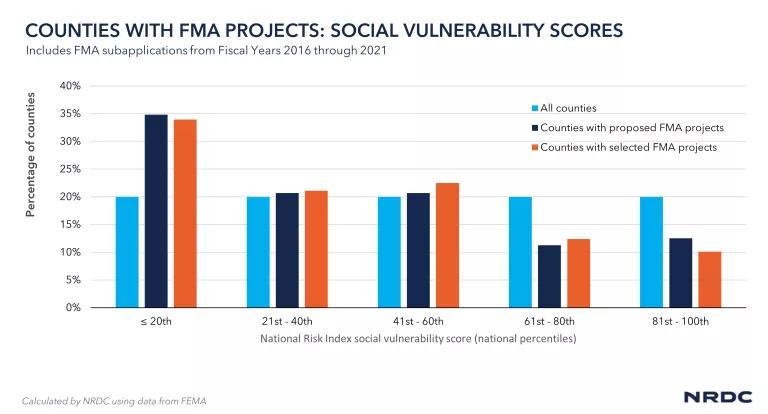
Counties with FMA projects (regardless of whether FEMA selects those projects for funding) tend to have lower social vulnerability than the country overall.
In comparison, the picture for BRIC projects (shown in the chart below) is a bit more complex. The counties with proposed and selected projects tend to have lower social vulnerability scores than the nation overall, but the scores of counties with projects selected in the national competition are more variable. This is likely related to the small number of counties that were successful in the national competition (fewer than 60 over the first two years of the program, compared to over 600 that proposed projects under any of BRIC’s funding categories). In addition, however, several counties in this set have large numbers of socially vulnerable residents—but also high levels of municipal capacity. For example, New York City, Boston, Philadelphia, and Miami all have successful projects.
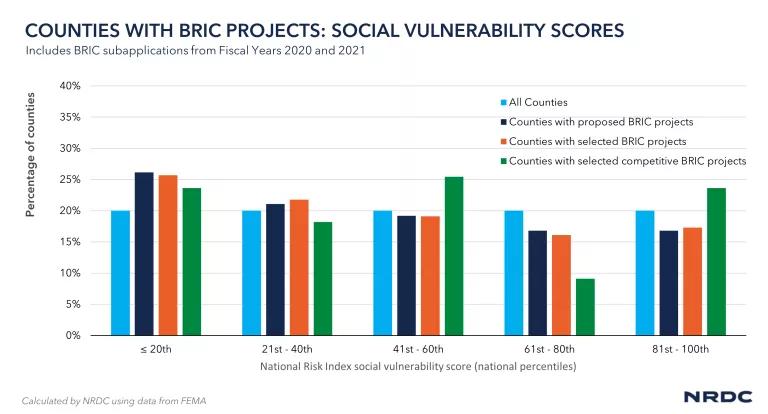
Counties with BRIC projects have mixed social vulnerability scores, especially for projects in the national competition.
Of course, all communities deserve support to address the risks of climate change, and underserved communities within big cities should absolutely benefit from their local governments’ investments in resilience. And FEMA should absolutely continue working to prioritize projects that center marginalized, disinvested, and disproportionately burdened areas through their grant selection criteria, but it is critical that federal funding programs also recognize—and address—the disadvantage that lower-capacity jurisdictions have in accessing federal funds.
FEMA has already taken several good steps to do this and bolster capacity building assistance, but more action is needed. For example, FEMA could create a dedicated set-aside for capacity building in low-income communities, communities of color, and tribal communities. The agency could also allow high-priority capacity-building activities to be funded under the BRIC national competition, and incentivize these activities via increased prioritization points or a reduced cost share. It could more quickly ramp up its program to provide technical assistance directly to communities, or allow community-based organizations and other non-profits to apply for grants on behalf of local governments who can't do it themselves.
As FEMA continues to improve its grant programs, we hope to see improved access for the most vulnerable communities. If FEMA is to “instill equity as a foundation of emergency management,” supporting local capacity building must be a key priority.
Special thanks to Aqsa Mengal for her contributions to this analysis! Please contact us if you would like more information on our methods and datasets.


